2-year Treasury yield 2026: what it says about the Fed
The 2-year Treasury yield is the bond market's quickest read on Fed expectations, and June's jump to about 4.2% showed why traders watch it.
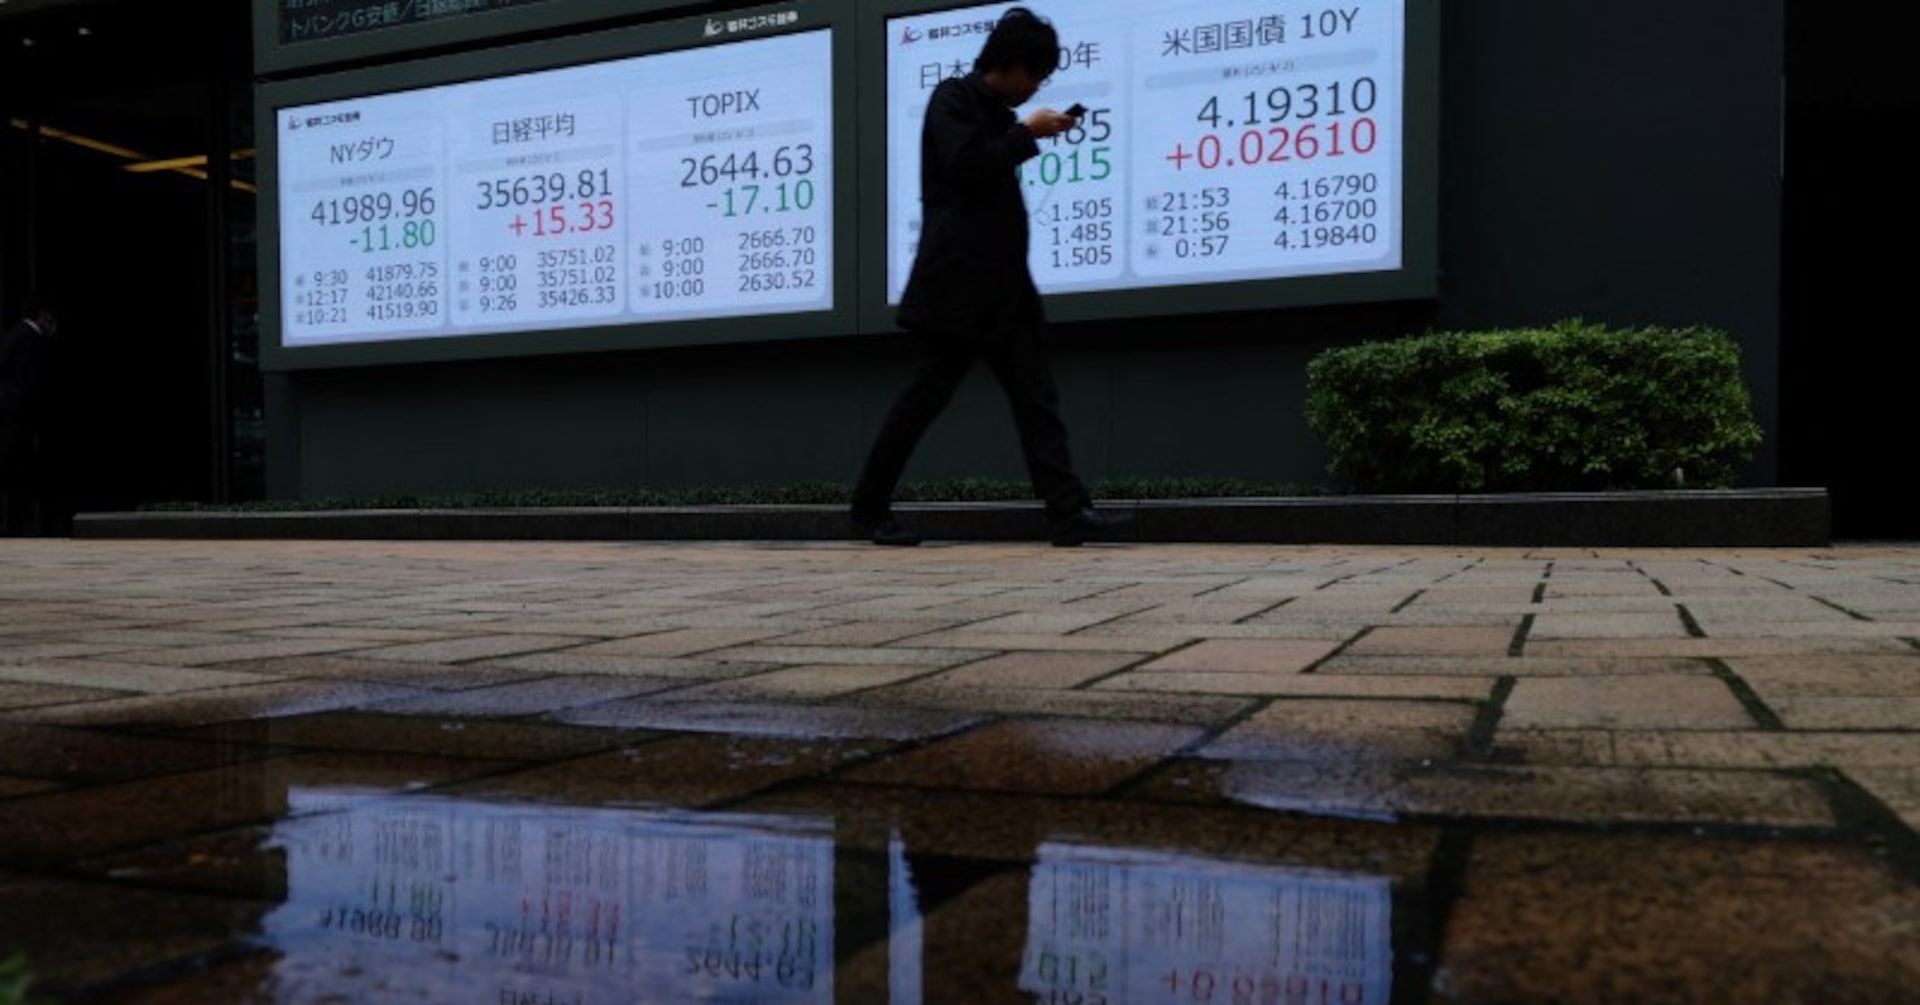
What is the 2-year Treasury yield signaling in 2026? Mid-June’s answer was blunt: the bond market had stopped looking for quick Federal Reserve cuts. At 4.207 per cent on June 17 and still near 4.179 per cent on June 18, the yield showed traders repricing a tighter path around Kevin Warsh’s first weeks as Fed chair.
Start with what the note measures. The 2-year Treasury sits near the part of the bond market most exposed to the federal funds rate, the overnight policy rate targeted by the Fed. Longer-dated notes can swing on inflation, growth and term premiums at the same time. Front-end debt is usually the cleaner read. Expect fewer cuts, or begin to price another hike, and the 2-year often reacts before the rest of the curve.
June made the point in real time. Reuters reported that futures markets were implying a 72 per cent chance of a Fed increase by October after strong retail-sales data and Warsh’s debut policy meeting. CNBC said the 2-year jumped more than 16 basis points on the decision day alone. One basis point is one hundredth of a percentage point, so 16 basis points is 0.16 percentage point. In the front end of the Treasury market, that is a large one-day reset.
“The yield on the 2-year U.S. Treasury note — most sensitive to changes in fed funds expectations — rose almost another three basis points.”
CNBC, June 18, 2026
A better shorthand is to treat the 2-year as a running poll of where bond traders think short-term US interest rates are headed over roughly the next two years. Nobody should read it as a prediction about the economy in 2030. Fed language hardens, data surprise on the upside, or markets decide policymakers have less room to ease, and this is where the change usually appears first.
Why the 2-year moves first
For investors, the edge is the time horizon. A Treasury yield is the annual return investors demand to hold a government bond to maturity. Because two years is short enough to sit inside the Fed’s policy window, pricing stays closely tied to expectations for the fed funds rate: hold steady, cut or hike.

Longer maturities carry more baggage. A 10-year Treasury still responds to the Fed, but it also absorbs views on future inflation, trend growth, federal borrowing and the extra compensation, known as the term premium, that investors require for lending money for longer. A rising 10-year yield can point to higher inflation risk. A rising 2-year yield can be a purer policy reset.
Put the two together and the June pattern is easier to read. When the 2-year jumps while the 10-year moves less, the message is usually about the Fed rather than a broader rethink of the economy. Short-dated yields pushed higher because traders concluded the hurdle for near-term easing had risen. In a higher-for-longer market, the 2-year tends to say that plainly.
Why the 2s10s spread is a different signal
Do not confuse the 2-year yield with the 2s10s spread. The T10Y2Y series on FRED measures the gap between the 10-year and 2-year Treasury constant-maturity yields, meaning both yields are standardised to fixed maturities so they can be compared across time. On July 1, the spread stood at 0.31 percentage point. Positive values mean the 10-year yield is above the 2-year; negative values mean the curve is inverted.
FRED’s own definition makes the distinction clear.
“The 10-year minus 2-year Treasury (constant maturity) yields: Positive values may imply future growth, negative values may imply economic downturns.”
FRED, Federal Reserve Bank of St. Louis
Policy pricing is what the 2-year captures. The 2s10s spread asks how that policy path compares with longer-run growth and recession expectations. A higher 2-year yield can sit alongside a positive spread, as it did in early July, if the 10-year yield is still higher. It can also flatten or invert the curve when the front end rises faster than the long end. Related signals, yes. Interchangeable, no.
That distinction matters in practice. Headlines often reduce the curve to a recession alarm, which can be useful but incomplete. In live markets, investors tend to watch the 2-year first to see how policy odds are changing. After that, the spread helps show whether tighter policy is starting to collide with weaker growth expectations. One signal is tactical. The other is macro.
What the June move meant
June 2026 offered a clean example. Warsh’s arrival did not just lift the level of short-term rates. It changed the range of outcomes investors considered plausible. A 72 per cent implied chance of a hike by October did not make a hike certain. It meant the market saw materially less room for quick cuts than it had before the meeting.
That is the 2-year’s practical use. Messy macro news gets translated into a narrower question: is the market moving toward easier policy, or away from it? A sharp fall usually points to weaker growth, softer inflation or a more dovish Fed. A sharp rise, like June’s, points to more persistence in restrictive policy.
Equity investors care because short-term yields feed into discount rates, bank funding assumptions and the relative appeal of cash. Currency and credit investors care because the 2-year often moves before those markets fully catch up. It is not a crystal ball. It is a market price. In a Fed-driven market, though, it is often one of the fastest honest signals available.
What to watch next
Next, watch what is moving the 2-year. Incoming inflation and labour-market data matter, as does Fed language under Warsh. So does the 10-year yield: is it confirming the front-end move or resisting it? If strong data keep pushing the 2-year higher while the 2s10s spread narrows, markets may be saying policy is getting tight enough to raise future growth concerns. If the 2-year falls and the spread steepens, the message is closer to easing.
Search interest around the 2-year Treasury yield has picked up for a reason in 2026. The number compresses a lot of debate into a single market price. Read carefully, it is less a verdict on the whole economy than a live translation of what investors think the Fed is about to do next.
Helena Brandt
Macro reporter covering the Federal Reserve, ECB, inflation prints and jobs data. Reports from Washington.